Social networking has grown from a small niche product into a global phenomenon. Social media platforms like Facebook, Twitter, and Instagram play an increasingly large role in modern human experience. For better or worse, social media is here to stay. But just how much of an effect is it having on our lives? What is the average time spent on social media platforms?
The answer may surprise you.
Globally, the average internet user uses social media for 144 minutes per day. That’s 2 hours and 24 minutes of social media time each and every day.
Let’s dive into the data and explore the increasingly large amount of time that we are spending on social platforms, and what kind of effects this time may be having on society as a whole.
How Much Time Do People Spend on Social Media Each Day?
The global average daily time on social media is 144 minutes, or 2 hours and 24 minutes. Of course, this figure varies by country, age group, etc. The graph below shows the average daily usage by continent.
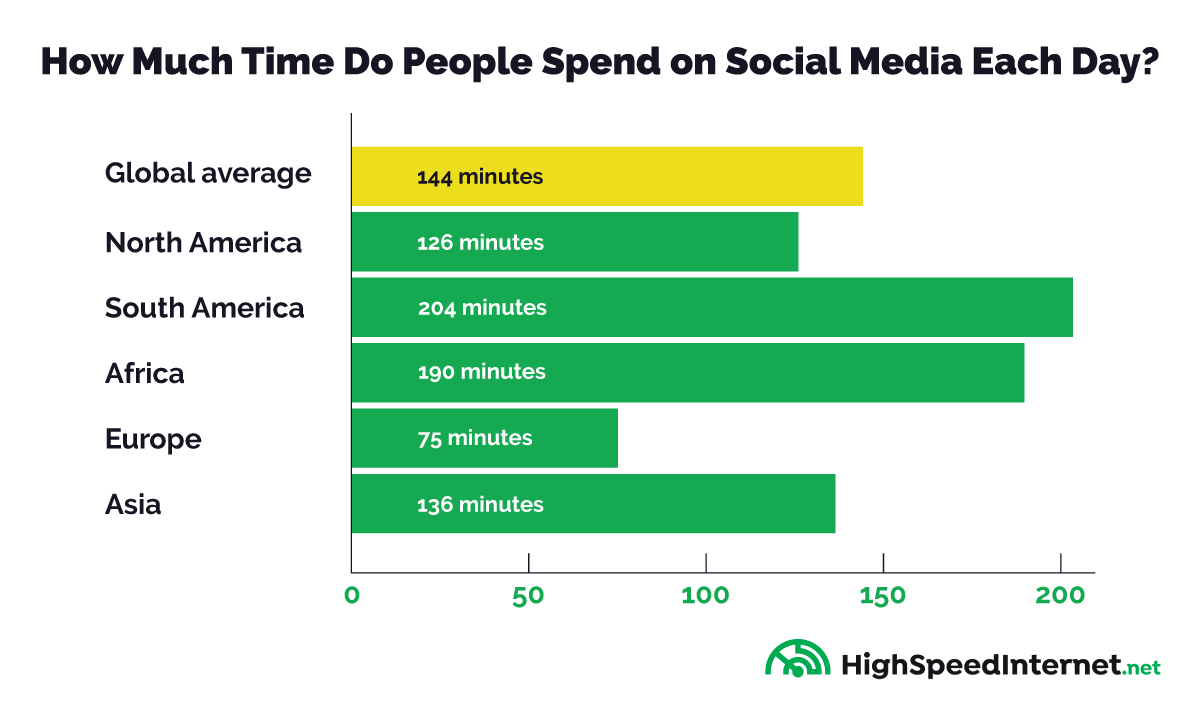
In the United States, the average social media user used social platforms for 1 hour and 57 minutes per day in 2018. Europeans use social media far less, with the continental average landing around 1 hour and 15 minutes per day.
The country with the highest social media consumption is The Philippines. In this tropical island nation, the average social media user spends more than 4 hours per day on social networking platforms.
Social Media Time vs. Other Activities
- Sleeping – 8.84 hours
- Working – 3.61 hours
- Watching TV – 2.81 hours
- Social media – 1.95 hours
- Cooking, cleaning, household activities – 1.78 hours
- Eating and drinking – 1.18 hours
- Socializing – 0.64 hours
- Exercise & recreation – 0.31 hours
To gain some perspective of just how pervasive social media has become, it’s useful to compare the time we spend on social media to the time we spend on other activities.
For instance, on a typical day, the average American spends 1.18 hours eating and drinking, 1.78 hours doing household activities including cooking and cleaning, and about 2.81 hours watching television.
The average person (among U.S. adults) spends on average 1 hour and 57 minutes on social media each day. That means we spend more time on social platforms than we spend cooking, cleaning, eating, or doing yard work!
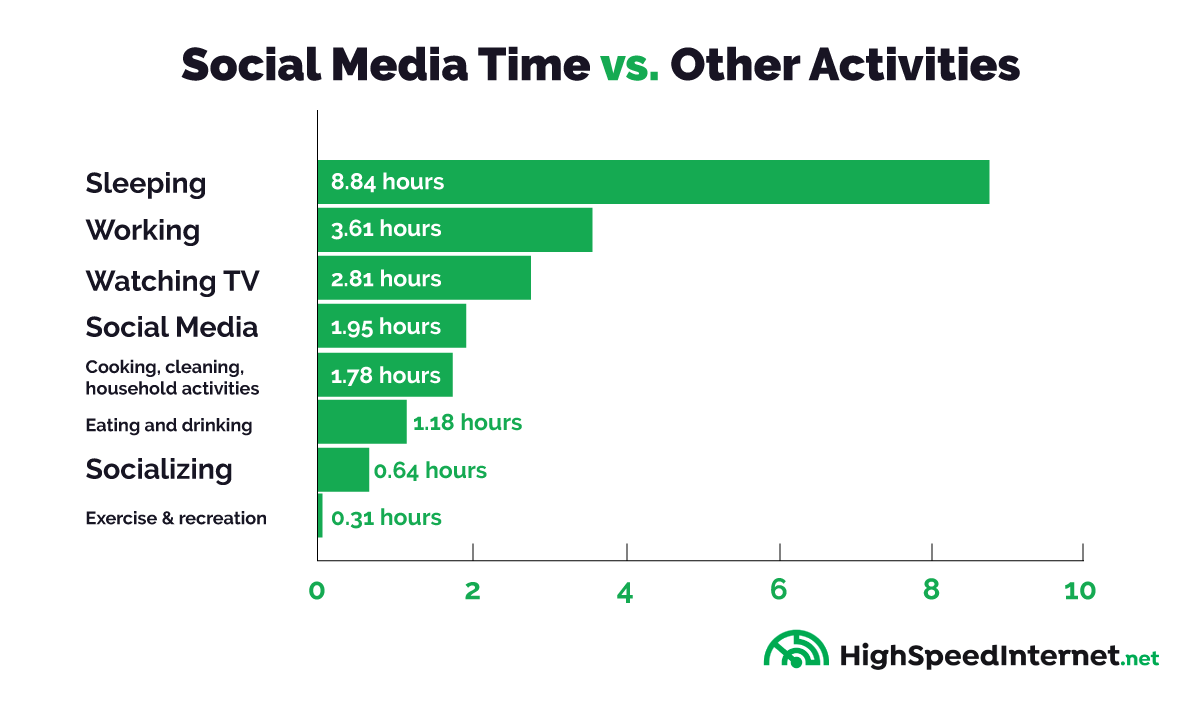
The average time on social media is increasing year by year. Soon enough, the average may even exceed television viewing, which averaged 2.81 hours per day in 2019. Eventually, it could even exceed the average time spent working, which was only 3.61 hours per day in 2019.
In terms of total time spent, social media time ranks behind only sleeping, working, and watching television. This raises the question: Is all this time spent on social platforms worthwhile? Is social media helping, or hurting our societies?
Who Uses Social Media in the United States?
It may seem like millennials and younger generations are the primary drivers behind the growth of social media platforms. However, the reality is that people of all age groups now use social media. In the United States, more than 71% of adults use at least one social media platform.
As you can imagine, different age groups have notably different behaviors when it comes to social media. Unsurprisingly, younger people tend to use social media more frequently, and for more hours per day, than older individuals.
Here’s a breakdown of the different age groups in the United States, and what percentage of each group uses at least one social media platform. This data was gathered by the Pew Research Center, a respected independent think tank.
- 90% of those ages 18-29
- 82% of those ages 30-49
- 69% of those ages 50-64
- 40% of those over age 65

Data for social media users under age 18 is sparse, largely due to privacy concerns for underage individuals. The anecdotal evidence we have suggests that the vast majority of teenagers use social media, and even many children under age 12 have a social media profile.
Of course, age is not the only factor at play. Gender is also significant, and the data reveals an interesting trend: Social media is notably more popular in the female population. In the US, 78% of adult women use social media, compared to just 65% of men.
What are the Most Popular Social Networks?
Globally, Facebook is the largest social network with over 2.6 billion active users. Given that the total world population is around 7.8 billion (including babies, toddlers, and millions without access to any sort of technology), this figure is truly staggering.
YouTube takes second place, with just over 2 billion users – however, YouTube is not thought of as a social network by many users.
WhatsApp, Facebook Messenger, WeChat, and Instagram are the other most popular social media platforms. Each service boasts more than 1 billion active users.
Identifying the biggest social media services is a bit tricky, as the definition of “social media” differs. For instance, some people consider YouTube a social network, while others do not. Likewise, messaging apps like Facebook Messenger, WeChat, and WhatsApp may or may not be considered true social media services.
The way popularity is measured also differs. Monthly active users are a common measurement, but often, measuring how much time people spend on these platforms is a better gauge.
Average Time Spent on Various Social Media Platforms
Most social networks are somewhat secretive about their internal data, so we do not have firm statistics to point to for the average time spent on Facebook, Instagram, Snapchat, or any other social media platform.
However, we do have data from some independent studies. An independent analysis by a company called SimilarWeb found the following data:
- Average time per day on Facebook – 58.5 minutes
- Average time per day on Instagram – 53.2 minutes
- Average time per day on Snapchat – 49.5 minutes
This data was collected from the average time spent on social media apps via Android mobile devices (mostly smartphones). It’s not a complete dataset, but it gives us a glimpse into average social media usage on various platforms. Keep in mind that Facebook users may indeed spend more than the listed 58.5 minutes on the network, as this data did not capture cross-platform use. Many people use Facebook on both smartphones and on their home computers.
Time spent on professional platforms like LinkedIn (e.g., to find a job), and the now-defunct Google+, are very low compared to the mainstream social networks. Newer platforms, like TikTok, don’t have much data yet, but their average daily use is skyrocketing.
Social media companies also do whatever they can to increase user engagement. These businesses make money primarily from advertising revenues, so the more time people spend on the platforms, the more profitable the companies are. Social media firms regularly introduce new features, such as infinite scrolling, that make the platforms even more engaging.
Other Social Media Statistics
Daily Use
The majority of social media users use their preferred platforms every day.
- 74% of Facebook users checked the platform at least once per day, along with 63% of Instagram users, 61% of Snapchat users, 51% of YouTube users, and 42% of Twitter users
Gender
- At least in the United States, social media is more popular with women than men. 78% of female adults had at least one social media profile, compared to 65% of men.
Screen Time
Social media is a major contributor to average screen time, which has been increasing dramatically.
- A small study found that RescueTime users spent around 3 hours and 15 minutes on their phones each day. This figure doesn’t include time spent in front of the TV or computer, stats which have also seen significant increases.
Increasing Usage
The average time spent on social media each day has been rising rapidly for the past decade.
- In 2012, the average social media users spent around 90 minutes on social media. In 2019, that figure was 144 minutes – a 60% increase in 7 years.
News
Social media started as a way to stay in touch with friends and family. Its role in our lives has since evolved.