A world without the internet is nearly impossible to imagine. The internet connects us to information, resources, and each other, and has a profound impact on the way we live our lives. Globally, more than 4.57 billion people are active internet users, and that figure grows each and every day.
As technology evolves, the ways in which people access the internet are rapidly shifting. What started as a network connecting almost exclusively desktop computers to the world wide web has quickly evolved into a mobile-dominated network. Today, internet-connected devices include everything from laptops to tablets to smartphones, and in the developed world, even vehicles and refrigerators.
The rise of mobile devices and smartphones has radically changed internet usage statistics, shifting from a desktop-dominated internet into a mobile-dominated landscape. It’s fascinating to explore mobile and desktop internet usage statistics, which is exactly what this article will do.
Mobile vs Desktop Internet Usage Statistics in 2020 (Global)
Today, the majority of internet traffic comes from mobile sources (and predominantly from smartphones). Globally, the latest statistics indicate that approximately 50.88% of all internet traffic can be attributed to mobile devices/smartphones.
As of 2020, here is the global breakdown of internet traffic:
- 50.88% mobile
- 46.39% desktop
- 2.74% tablet
For those reading this article on a desktop computer, this information may surprise you. But looking at it from a global perspective, the numbers make sense. The biggest factor driving mobile’s dominance globally is the affordability of mobile devices and smartphones.
 Lower-income individuals can often afford a basic smartphone and mobile internet access, but can’t necessarily afford a desktop or laptop computer. This is particularly true in emerging economies, where cheap mobile devices are plentiful.
Home internet, or WiFi, is another factor. In the developed world, we may think of “the internet” as having an internet-connected device hooked up to a WiFi network. However, globally, a huge percentage of people access the internet exclusively via their mobile phone network. The latest statistics indicate that only 1.145 billion households have a wired home broadband subscription, compared to the 4.57 billion global internet users.
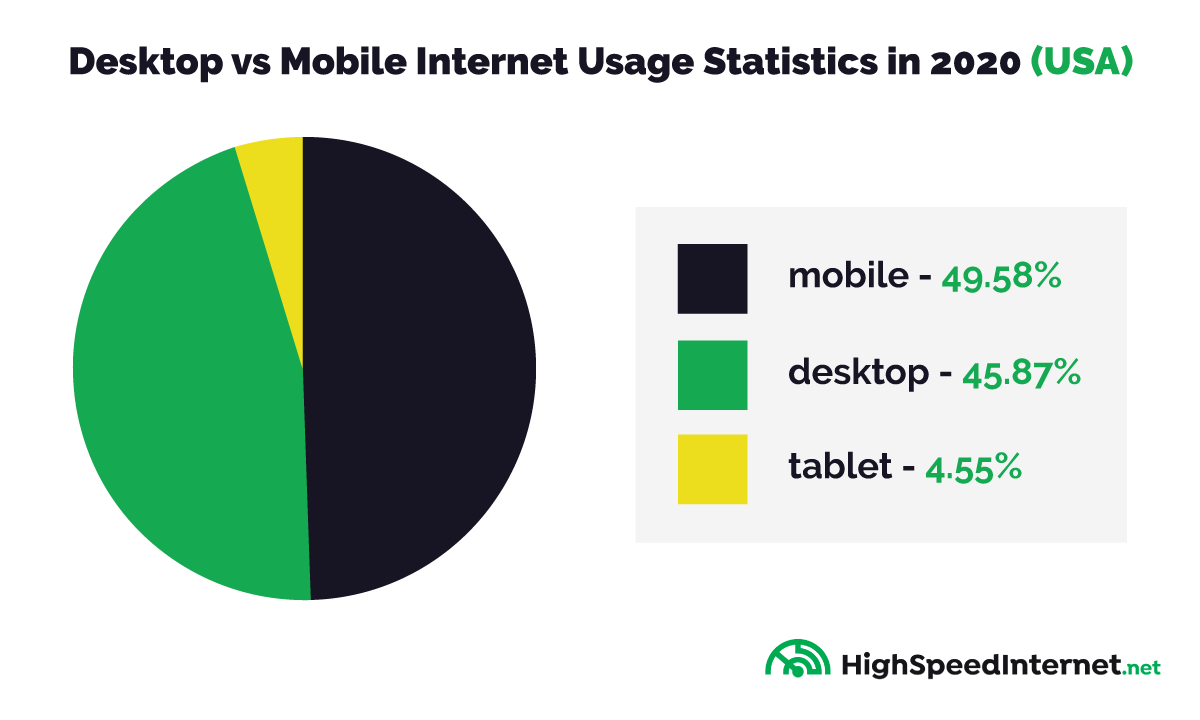
Desktop vs Mobile Internet Usage Statistics in 2020 (USA)
If we zoom in on just the United States, the data looks a bit different. In the US, desktop traffic accounts for approximately 49.58% of all web usage.
Here is the breakdown of internet usage statistics in the United States:
- 49.58% desktop
- 45.87% mobile
- 4.55% tablet
Several factors contribute to desktop internet usage stats in the United States. For one, it’s a relatively wealthy country, where most households own desktop or laptop computers. US Census data from 2016 indicated that approximately 77% of US households owned a laptop or desktop computer, and that figure is likely higher today.
The work culture in the United States also contributes. Over 41% of workers in the United States are in the Professional and Technical workforce category, and most of these positions require frequent desktop usage while interacting with the internet. Compare this to a more manufacturing or agricultural driven economy, and it’s easy to see how internet users in the United States still spend more time on desktops than on mobile devices.
The Shift from Desktop to Mobile Internet Access
What’s fascinating to think about is just how fast the internet has shifted from almost exclusively desktop-driven to mostly mobile-driven. Just a decade ago, in 2010, over 97% of all global web traffic came from desktop computers. Today, that figure is just 46%. The first time that mobile overtook desktop in terms of total market share was back in 2016.
Several factors contributed to this rapid shift. Most notably, the rise of the smartphone has completely changed the landscape. In the developed world, the vast majority of adults own smartphones. In the United States, for example, over 81% of citizens are smartphone users, according to Pew Research data from 2019. The introduction of smartphones has made it easier for people to access the internet whenever they want, and wherever they are.
In the developing world, smartphones have had an even bigger impact on mobile internet usage. Around 45% of individuals in emerging economies own or have access to a smartphone. The percentage of mobile users in the developing world is growing rapidly, and mobile usage is a primary driver in spreading internet access to the global population. Internet-connected mobile devices provide an accessible, affordable way to access the web in emerging economies.
The shift from desktop to mobile has forced businesses and organizations to make significant changes. 10 years ago, the common advice was that every business needed a website. Now, having a mobile site, or at least mobile-friendly web pages, is essential.
Types of Internet Usage on Desktop & Mobile Devices
Of course, the type of activities that internet users engage in on mobile is notably different than typical internet activities that are performed on desktop computers. Global data on the subject is sparse, but here’s a breakdown of data in the United States:
Search Engine Activity
- Approximately 58% of all search engine activity on Google originates from mobile searches, compared to around 40% on desktop. Desktop search activity also differs from mobile searches in a number of ways.
- For instance, the volume of local search queries (such as “restaurants near me”) has declined among desktop users but continues to rise exponentially for those searching on mobile phones.
Social Media Usage
- Approximately 83% of all social media visits are from mobile devices, compared to around 15% on desktops or laptop computers.
- In fact, roughly half of social media users only use mobile devices to access their social network of choice. This can largely be attributed to the popularity of social media apps on smartphones, and increased smartphone use in general.
E-Commerce
- Approximately 28% of online e-commerce sales are made via mobile devices, compared to more than 70% on desktop. Interestingly, it appears that internet users like to browse e-commerce apps on mobile devices, but prefer to do their actual buying on desktops.
- The conversion rate (or percentage of visits that results in an actual sale) was about 4.14% on desktop, compared to just 1.53% on mobile devices.
- For eCommerce businesses, mobile traffic makes up the lion’s share of total traffic, yet accounts for a much smaller percentage of revenues. As online shopping becomes increasingly popular, eCommerce businesses will have to adapt mobile website designs to help improve conversions.
Web Browsing
- When it comes to browsing the web (outside of specific mobile apps), desktop remains dominant. While mobile visits made up 58% of US searches, they only accounted for approximately 42% of total time spent online. In other words, more individual searches are made on mobile, but more time is spent browsing the web on desktops.
Gaming
Online gaming remains exceedingly popular on both desktop PC and mobile devices. Statistics are difficult to measure across so many different platforms and categories, but we can gain some insight from the data available.
- In terms of spending, approximately 25% of gaming revenues come from PC gamers, compared to 28% from gaming consoles and 47% from mobile gaming. Part of this disconnect can be explained by the prohibitive costs of desktop devices capable of gaming, compared to the relatively low cost of mobile gaming devices and smartphones.
Insights & Analysis
From all this data, we can glean some significant insights into the current state of internet usage, and perhaps even the future outlook for the World Wide Web.
- Overall, desktop usage is decreasing while smartphone and mobile device usage continues to grow.
- Most smartphone internet activity takes place through mobile apps downloaded through the official app store, rather than mobile web browsers. Around 90% of total time spent on mobile devices is spent directly in smartphone apps.
- Despite Apple’s dominance in the United States, globally, devices running Google‘s Android operating system make up 87% of the global smartphone market.
- More website traffic comes from mobile devices than desktop computers. However, desktop users tend to spend a longer time on websites, and desktop conversion rates are far higher for eCommerce businesses.
- Current trends, including the shift from desktop to mobile, are likely to accelerate as mobile devices reach more people in developing nations
- Global trends can be quickly shifted by changes in developing nations. For example, China alone has accounted for roughly 605 million new internet users since 2008, with most of those users accessing the internet on mobile devices
- Changing demographics, mostly in regards to the average age and average household income, can have a huge effect on internet usage stats. Younger generations are spending more time online than ever before, and as global poverty rates decline, more and more people are able to become mobile internet users